It is impossible to claim that you know mathematics if you do not know how to draw graphs, draw inequalities on a coordinate line, and work with coordinate axes. The visual component in science is vital, because without visual examples in formulas and calculations, you can sometimes get very confused. In this article we will see how to work with coordinate axes and learn how to build the simplest graphs of functions.
Application
The coordinate line is the basis of the simplest types of graphs that a student encounters on his educational path. It is used in almost every mathematical topic: when calculating speed and time, projecting the size of objects and calculating their area, in trigonometry when working with sines and cosines.
The main value of such a straight line is clarity. Since mathematics is a science that requires a high level of abstract thinking, graphs help in representing an object in the real world. How does he behave? At what point in space will it be in a few seconds, minutes, hours? What can you say about it in comparison with other objects? What speed does it have at a randomly chosen moment in time? How to characterize his movement?
And we are talking about speed for a reason - it is it that is often displayed by function graphs. They can also display changes in temperature or pressure inside an object, its size, orientation relative to the horizon. Thus, it is often required to construct a coordinate line in physics.
One-dimensional graph
There is a concept of multidimensionality. Only one number is enough to determine the location of the point. This is exactly the case with the use of the coordinate line. If the space is two-dimensional, then two numbers are required. Charts of this type are used much more often, and a little further in the article we will definitely consider them.

What can you see with points on the axis if there is only one? You can see the size of the object, its position in space relative to some "zero", that is, the point selected as the origin.
Changes in parameters over time cannot be seen, since all readings will be displayed for one specific moment. However, you have to start somewhere! So let's get started.
How to plot a coordinate axis
First, you need to draw a horizontal line - this will be our axis. On the right side, "sharpen" it so that it looks like an arrow. This will indicate the direction in which the numbers will increase. The arrow is usually not placed in the direction of decreasing. Traditionally, the axis is directed to the right, so we'll just follow this rule.

Let's put a zero mark, which will display the origin. This is the very place from which the countdown is conducted, whether it be size, weight, speed, or whatever. In addition to zero, we must definitely designate the so-called division price, that is, introduce the unit standard, in accordance with which we will plot certain values on the axis. This must be done in order to be able to find the length of a segment on a coordinate line.
Through an equal distance from each other, put dots or "notches" on the line, and under them we write respectively 1,2,3 and so on. And now, everything is ready. But you still need to learn how to work with the resulting schedule.
Types of points on the coordinate line
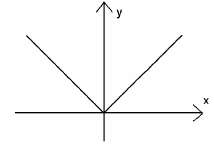
At the first glance at the drawings proposed in the textbooks, it becomes clear: points on the axis can be painted over or not painted over. Do you think this is an accident? Not at all! A "solid" point is used for a non-strict inequality - a volume that reads "greater than or equal to". If it is necessary to strictly limit the interval (for example, "x" can take values from zero to one, but does not include it), we will use a "hollow" point, that is, in fact, a small circle on the axis. It should be noted that students are not very fond of strict inequalities, because they are more difficult to work with.

The plotted intervals will be named depending on what points you use on the chart. If the inequality on both sides is not strict, then we get a segment. If on the one hand it turns out to be "open", then it will be called a half-interval. Finally, if a part of a straight line is bounded on both sides by hollow points, it will be called an interval.
Plane
When constructing two lines on, we can already consider the graphs of functions. Let's say the horizontal line will be the time axis and the vertical line will be the distance. And now we are already able to determine what distance the object will cover in a minute or an hour. Thus, working with a plane makes it possible to monitor the change in the state of an object. This is much more interesting than static state research.
The simplest graph on such a plane is a straight line; it reflects the function Y (X) = aX + b. Does the line bend? This means that the object changes its characteristics during the research process.

Imagine you are standing on the roof of a building and holding a stone in your outstretched hand. When you release it, it will fly downward, starting at zero speed. But in a second he will cover 36 kilometers per hour. The stone will continue to accelerate further, and in order to draw its movement on the graph, you will need to measure its speed at several points in time by placing points on the axis in the appropriate places.
The marks on the horizontal coordinate line are named X1, X2, X3 by default, and on the vertical coordinate line - Y1, Y2, Y3, respectively. By projecting them onto a plane and finding intersections, we find fragments of the resulting image. By connecting them with one line, we get a graph of the function. In the case of a falling stone, the quadratic function will be: Y (X) = aX * X + bX + c.
Scale
Of course, it is not necessary to put integer values next to divisions by a straight line. If you are considering the movement of a snail that is crawling at a speed of 0.03 meters per minute, set it as the values on the coordinate fraction. In this case, set the graduation to 0.01 meters.
It is especially convenient to carry out such drawings in a notebook in a cage - here you can immediately see whether there is enough space on the sheet for your schedule, whether you will go out of the margins. It's easy to calculate your strength, because the width of the cell in such a notebook is 0.5 centimeters. It took - we reduced the drawing. Changing the scale of the graph will not lose or change its properties.
Point and line coordinates
When a mathematical problem is given in a lesson, it can contain parameters of various geometric shapes, both in the form of side lengths, perimeter, area, and in the form of coordinates. In this case, you may need to both build a shape and get some data associated with it. The question arises: how to find the required information on the coordinate line? And how to build a figure?

For example, we are talking about a point. Then a capital letter will appear in the problem statement, and there will be several numbers in brackets, most often two (this means we will count in two-dimensional space). If there are three numbers in brackets, written with a semicolon or a comma, then this is a three-dimensional space. Each of the values is a coordinate on the corresponding axis: first along the horizontal (X), then along the vertical (Y).
Remember how to draw a line? You went through this in geometry. If there are two points, then a straight line can be drawn between them. Their coordinates are indicated in brackets if a segment appears in the problem. For example: A (15, 13) - B (1, 4). To build such a straight line, you need to find and mark points on the coordinate plane, and then connect them. That's all!
And any polygons, as you know, can be drawn using line segments. The problem has been solved.
Calculations
Let's say there is some object whose position along the X axis is characterized by two numbers: it starts at a point with a coordinate (-3) and ends at (+2). If we want to find out the length of this object, then we must subtract the smaller from the larger number. Note that a negative number absorbs the sign of the subtraction, because "minus and minus equals plus". So we add (2 + 3) and get 5. This is the desired result.

Another example: we are given the end point and length of the object, but the initial one is not given (and we need to find it). Let the position of the known point be (6), and the size of the studied subject - (4). Subtracting the length from the final coordinate, we get the answer. Total: (6 - 4) = 2.
Negative numbers
It is often required in practice to work with negative values. In this case, we will move along the coordinate axis to the left. For example, an object 3 centimeters high is floating in water. It is immersed in liquid by a third, and in air by two thirds. Then, choosing the surface of the water as the axis, we, using the simplest arithmetic calculations, get two numbers: the upper point of the object has the coordinate (+2), and the lower one - (-1) centimeter.
It is easy to see that in the case of a plane, we have four quarters of the coordinate line. Each of them has its own number. In the first (upper right) part there will be points with two positive coordinates, in the second - from the top left - the values along the "x" axis will be negative, and along the "yoke" - positive. The third and fourth are counted further counterclockwise.
Important property
You know that a straight line can be thought of as an infinite number of points. We can look as carefully as we want any number of values in each direction of the axis, but we will not find repetitive ones. This seems naive and understandable, but that statement stems from an important fact: each number corresponds to one and only one point on the coordinate line.
Conclusion
Remember that any axes, shapes and, if possible, charts should be drawn using a ruler. The units of measurement were not invented by a person by chance - if you make an error in drawing, you risk seeing the image that was not supposed to turn out.
Be careful and accurate in charting and calculating. Like any science taught in school, mathematics loves precision. Put in a little effort, and good grades will not be long in coming.
Let us show how the lines are transformed if the modulus sign is introduced into the equation for specifying the line.
Let we have the equation F (x; y) = 0 (*)
· The equation F (| x |; y) = 0 defines a line symmetric about the ordinate axis. If this line, given by the equation (*), has already been built, then we leave part of the line to the right of the ordinate axis, and then complete it on the left in a symmetrical manner.
· The equation F (x; | y |) = 0 defines a line symmetric about the abscissa axis. If this line, given by the equation (*), has already been built, then we leave part of the line above the abscissa axis, and then complete it from below in a symmetrical manner.
· The equation F (| x |; | y |) = 0 defines a line symmetric about the coordinate axes. If the line given by the equation (*) has already been built, then we leave part of the line in the first quarter, and then we complete it in a symmetrical manner.
Consider the following examples
Example 1.
Let we have a straight line given by the equation:
(1), where a> 0, b> 0.
Draw lines given by equations:
Solution:
First, we will construct the initial line, and then, using the recommendations, we will construct the rest of the lines.
| NS |
| at |
| but |
| b |
| (1) |
| (2) |
| b |
| -a |
| a |
| y |
| x |
| x |
| y |
| a |
| (3) |
| -b |
| b |
| x |
| y |
| -a |
| NS |
| -a |
| b |
| (5) |
| a |
| -b |
Example 5
Draw on the coordinate plane the area specified by the inequality:
Solution:
First, we build the boundary of the region, given by the equation:
| (5)
In the previous example, we got two parallel lines that divide the coordinate plane into two areas:
The area between the lines
The area outside the straight lines.
To select our area, take a control point, for example, (0; 0) and substitute it into this inequality: 0≤1 (true) ®area between straight lines, including the border.
Please note that if the inequality is strict, then the border is not included in the area.
Let's keep the given circle and construct it symmetrical about the ordinate axis. Let's keep the given circle and construct it symmetrical about the abscissa axis. Let's keep the given circle and construct it symmetrical about the abscissa axis. and the ordinate axis. As a result, we get 4 circles. Note that the center of the circle is in the first quarter (3; 3), and the radius is R = 3.| at |
| -3 |
| NS |
A rectangular coordinate system is a pair of perpendicular coordinate lines, called coordinate axes, that are placed so that they intersect at their origin.
The designation of the coordinate axes by the letters x and y is generally accepted, however, the letters can be any. If the letters x and y are used, then the plane is called xy-plane... Letters other than the letters x and y may be used in various applications, and as shown in the figures below, there is uv-plane and ts-plane.

Ordered pair
By an ordered pair of real numbers, we mean two real numbers in a specific order. Each point P in the coordinate plane can be associated with a unique ordered pair of real numbers by drawing two lines through point P: one perpendicular to the x-axis and the other perpendicular to the y-axis.

For example, if we take (a, b) = (4,3), then on the coordinate strip

To construct a point P (a, b) means to define a point with coordinates (a, b) on the coordinate plane. For example, various points are plotted in the figure below.

In a rectangular coordinate system, the coordinate axes divide the plane into four areas called quadrants. They are numbered counterclockwise in Roman numerals as shown in the figure.

Defining a schedule
Schedule equations with two variables x and y, is called the set of points on the xy-plane, the coordinates of which are members of the set of solutions of this equation
Example: draw a graph y = x 2
Since 1 / x is undefined when x = 0, we can only construct points for which x ≠ 0

Example: Find All Axis Intersections
(a) 3x + 2y = 6
(b) x = y 2 -2y
(c) y = 1 / x
Let y = 0, then 3x = 6 or x = 2
is the desired point of intersection of the x-axis.
Having established that x = 0, we find that the point of intersection of the y-axis is the point y = 3.
This way you can solve equation (b), and the solutions for (c) are given below.
x-intersection
Let y = 0
1 / x = 0 => x cannot be determined, i.e. no y-axis intersection
Let x = 0
y = 1/0 => y is also undefined, => no y-intercept
In the figure below, the points (x, y), (-x, y), (x, -y), and (-x, -y) represent the corners of the rectangle.

The graph is symmetrical about the x-axis, if for each point (x, y) of the graph, the point (x, -y) is also a point on the graph.
The graph is symmetrical about the y-axis if, for each point on the graph (x, y), the point (-x, y) also belongs to the graph.
The graph is symmetrical about the center of coordinates, if for each point (x, y) of the graph, the point (-x, -y) also belongs to this graph.


Definition:
Schedule function on the coordinate plane is defined as the graph of the equation y = f (x)
Plot f (x) = x + 2

Example 2. Plot the graph f (x) = | x |
Plot coincides with the line y = x for x > 0 and with line y = -x
for x< 0 .


graph of f (x) = -x
Combining these two graphs, we get
graph f (x) = | x |
Example 3. Build a graph
t (x) = (x 2 - 4) / (x - 2) =
= ((x - 2) (x + 2) / (x - 2)) =
= (x + 2) x ≠ 2
Therefore, this function can be written as
y = x + 2 x ≠ 2

Graph h (x) = x 2 - 4 Or x - 2
graph y = x + 2 x ≠ 2
Example 4. Build a graph
Function plots with displacement
Suppose that the graph of the function f (x) is known
Then we can find graphs
y = f (x) + c - graph of the function f (x), moved
UP by c values
y = f (x) - c - graph of the function f (x), moved
DOWN by c values
y = f (x + c) - graph of the function f (x), moved
LEFT by c values
y = f (x - c) - graph of the function f (x), moved
Right c values
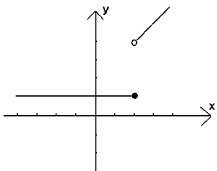
Example 5. Build
graph y = f (x) = | x - 3 | + 2
Move the graph y = | x | 3 values RIGHT to get the graph
Move the graph y = | x - 3 | 2 values UP to get the graph y = | x - 3 | + 2
Build a graph
y = x 2 - 4x + 5
We transform the given equation as follows, adding 4 to both sides:
y + 4 = (x 2 - 4x + 5) + 4 y = (x 2 - 4x + 4) + 5 - 4
y = (x - 2) 2 + 1
Here we see that this graph can be obtained by moving the graph y = x 2 to the right by 2 values, because x is 2, and up by 1 value, because +1.
y = x 2 - 4x + 5

Reflections
(-x, y) is the reflection of (x, y) about the y-axis
(x, -y) is the reflection of (x, y) about the x-axis
Graphs y = f (x) and y = f (-x) are a reflection of each other about the y-axis
The graphs y = f (x) and y = -f (x) are a reflection of each other about the x-axis
The graph can be obtained by reflection and movement:
Draw a graph
Let's find its reflection about the y-axis, and get a graph
Let's move this graph to the right by 2 values and get a graph
Here is the graph you are looking for

If f (x) is multiplied by a positive constant c, then
the f (x) graph shrinks vertically if 0< c < 1
the graph f (x) is stretched vertically if c> 1

Curve is not a graph of y = f (x) for any function f
A straight line is quite definite if two points belonging to it are known. In order to construct a straight line from its equation, it is necessary, using this equation, to find the coordinates of its two points. It should be firmly remembered that if a point belongs to a straight line, then the coordinates of this point satisfy the equation of a straight line.
In the practical construction of a straight line according to its equation, the most accurate graph will be obtained when the coordinates of the two points taken for its construction are integers.
1. If the straight line is defined by the general equation Ax + By + C= 0 and, then for its construction the easiest way is to determine the points of intersection of the straight line with the coordinate axes.
We will indicate how to determine the coordinates of the points of intersection of a straight line with the coordinate axes. Coordinates of the point of intersection of a straight line with an axis Ox are found from the following considerations: the ordinates of all points located on the axis Ox are equal to zero. In the equation of the straight line, it is assumed that y is equal to zero, and from the resulting equation find x... Found value x and is the abscissa of the point of intersection of a straight line with an axis Ox... If it turns out that x = a, then the coordinates of the point of intersection of the straight line with the axis Ox will ( a, 0).
To determine the coordinates of the point of intersection of a straight line with an axis Oy, argue as follows: the abscissas of all points located on the axis Oy are equal to zero. Taking the straight line in the equation x equal to zero, from the resulting equation determine y... Found value y and will be the ordinate of the intersection of the straight line with the axis Oy... If it turns out, for example, that y = b, then the point of intersection of the straight line with the axis Oy has coordinates (0, b).
Example. Straight 2 x + y- 6 = 0 crosses the axis Ox at the point (3, 0). Indeed, taking in this equation y= 0, we obtain to determine x equation 2 x- 6 = 0, whence x = 3.
To determine the point of intersection of this line with the axis Oy, put in the equation the straight line x= 0. We obtain the equation y- 6 = 0, from which it follows that y= 6. Thus, the straight line intersects the coordinate axes at points (3, 0) and (0, 6).
If in the general equation the straight line C= 0, then the straight line defined by this equation passes through the origin. Thus, one of its points is already known, and to construct a straight line, it remains only to find another point of it. Abscissa x this point is set arbitrarily, and the ordinate y are found from the equation of the straight line.
Example. Straight 2 x - 4y= 0 goes through the origin. We define the second point of the straight line, taking, for example, x= 2. Then, to determine y we get the equation 2 * 2 - 4 y = 0; 4y = 4; y= 1. So, line 2 x - 4y= 0 passes through the points (0, 0) and (2, 1).
If the straight line is given by the equation y = kx + b with the slope, then the value of the segment is already known from this equation b cut off by a straight line on the ordinate axis, and to construct a straight line, it remains to determine the coordinates of only one more point belonging to this straight line. If in the equation y = kx + b, then it is easiest to determine the coordinates of the point of intersection of the straight line with the axis Ox... Above, it was indicated how to do this.
If in the equation y = kx + b b= 0, then the straight line passes through the origin of coordinates, and thus one point belonging to it is already known. To find another point, one should give x any value and determine the direct value from the equation y corresponding to this value x.
Example. The straight line passes through the origin and point (2, 1), since at x= 2 from her equation.
Equation of a straight line passing through a given point in a given direction. Equation of a straight line passing through two given points. The angle between two straight lines. The condition of parallelism and perpendicularity of two lines. Determination of the intersection point of two lines
1. Equation of a straight line passing through a given point A(x 1 , y 1) in a given direction, determined by the slope k,
y - y 1 = k(x - x 1). (1)
This equation defines a bundle of straight lines passing through the point A(x 1 , y 1), which is called the center of the beam.
2. Equation of a straight line passing through two points: A(x 1 , y 1) and B(x 2 , y 2) is written as follows:
The slope of a straight line passing through two given points is determined by the formula
3. Angle between straight lines A and B called the angle by which you need to turn the first straight line A around the point of intersection of these lines counterclockwise until it coincides with the second line B... If two straight lines are given by equations with a slope
y = k 1 x + B 1 ,
y = k 2 x + B 2 , (4)
then the angle between them is determined by the formula
Note that in the numerator of the fraction, the slope of the first straight line is subtracted from the slope of the second straight line.
If the equations of the straight line are given in general form
A 1 x + B 1 y + C 1 = 0,
A 2 x + B 2 y + C 2 = 0, (6)
the angle between them is determined by the formula
4. Conditions for parallelism of two lines:
a) If the straight lines are given by equations (4) with a slope, then the necessary and sufficient condition for their parallelism consists in the equality of their slopes:
k 1 = k 2 . (8)
b) For the case when the straight lines are given by equations in general form (6), the necessary and sufficient condition for their parallelism is that the coefficients at the corresponding current coordinates in their equations are proportional, i.e.
5. Conditions for perpendicularity of two lines:
a) In the case when the straight lines are given by equations (4) with the slope, the necessary and sufficient condition for their perpendicularity is that their slopes are reciprocal in magnitude and opposite in sign, i.e.
It is impossible to claim that you know mathematics if you do not know how to draw graphs, draw inequalities on a coordinate line, and work with coordinate axes. The visual component in science is vital, because without visual examples in formulas and calculations, you can sometimes get very confused. In this article we will see how to work with coordinate axes and learn how to build the simplest graphs of functions.
Application
The coordinate line is the basis of the simplest types of graphs that a student encounters on his educational path. It is used in almost every mathematical topic: when calculating speed and time, projecting the size of objects and calculating their area, in trigonometry when working with sines and cosines.
The main value of such a straight line is clarity. Since mathematics is a science that requires a high level of abstract thinking, graphs help in representing an object in the real world. How does he behave? At what point in space will it be in a few seconds, minutes, hours? What can you say about it in comparison with other objects? What speed does it have at a randomly chosen moment in time? How to characterize his movement?
And we are talking about speed for a reason - it is it that is often displayed by function graphs. They can also display changes in temperature or pressure inside an object, its size, orientation relative to the horizon. Thus, it is often required to construct a coordinate line in physics.
One-dimensional graph
There is a concept of multidimensionality. In one-dimensional space, just one number is enough to determine the location of a point. This is exactly the case with the use of the coordinate line. If the space is two-dimensional, then two numbers are required. Charts of this type are used much more often, and a little further in the article we will definitely consider them.
 What can you see with points on the axis if there is only one? You can see the size of the object, its position in space relative to some "zero", that is, the point selected as the origin.
Changes in parameters over time cannot be seen, since all readings will be displayed for one specific moment. However, you have to start somewhere! So let's get started.
How to plot a coordinate axis
First, you need to draw a horizontal line - this will be our axis. On the right side, "sharpen" it so that it looks like an arrow. This will indicate the direction in which the numbers will increase. The arrow is usually not placed in the direction of decreasing. Traditionally, the axis is directed to the right, so we'll just follow this rule.
 Let's put a zero mark, which will display the origin. This is the very place from which the countdown is conducted, whether it be size, weight, speed, or whatever. In addition to zero, we must definitely designate the so-called division price, that is, introduce the unit standard, in accordance with which we will plot certain values on the axis. This must be done in order to be able to find the length of a segment on a coordinate line.
Through an equal distance from each other, put dots or "notches" on the line, and under them we write respectively 1,2,3 and so on. And now, everything is ready. But you still need to learn how to work with the resulting schedule.
Types of points on the coordinate line
At the first glance at the drawings proposed in the textbooks, it becomes clear: points on the axis can be painted over or not painted over. Do you think this is an accident? Not at all! A "solid" point is used for a non-strict inequality - a volume that reads "greater than or equal to". If it is necessary to strictly limit the interval (for example, "x" can take values from zero to one, but does not include it), we will use a "hollow" point, that is, in fact, a small circle on the axis. It should be noted that students are not very fond of strict inequalities, because they are more difficult to work with.
 The plotted intervals will be named depending on what points you use on the chart. If the inequality on both sides is not strict, then we get a segment. If on the one hand it turns out to be "open", then it will be called a half-interval. Finally, if a part of a straight line is bounded on both sides by hollow points, it will be called an interval.
Plane
When constructing two straight lines on the coordinate plane, we can already consider the graphs of functions. Let's say the horizontal line will be the time axis and the vertical line will be the distance. And now we are already in a position to determine what distance the object will cover in a minute or an hour. Thus, working with a plane makes it possible to monitor the change in the state of an object. This is much more interesting than static state research.
The simplest graph on such a plane is a straight line; it reflects the function Y (X) = aX + b. Does the line bend? This means that the object changes its characteristics during the research process.
 Imagine you are standing on the roof of a building and holding a stone in your outstretched hand. When you release it, it will fly downward, starting at zero speed. But in a second he will cover 36 kilometers per hour. The stone will continue to accelerate further, and in order to draw its movement on the graph, you will need to measure its speed at several points in time by placing points on the axis in the appropriate places.
The marks on the horizontal coordinate line are named X1, X2, X3 by default, and on the vertical coordinate line - Y1, Y2, Y3, respectively. By projecting them onto a plane and finding intersections, we find fragments of the resulting image. By connecting them with one line, we get a graph of the function. In the case of a falling stone, the quadratic function will be: Y (X) = aX * X + bX + c.
Scale
Of course, it is not necessary to put integer values next to divisions by a straight line. If you are considering the movement of a snail that is crawling at a speed of 0.03 meters per minute, set it as the values on the coordinate fraction. In this case, set the graduation to 0.01 meters.
It is especially convenient to carry out such drawings in a notebook in a cage - here you can immediately see whether there is enough space on the sheet for your schedule, whether you will go out of the margins. It's easy to calculate your strength, because the width of the cell in such a notebook is 0.5 centimeters. It took - we reduced the drawing. Changing the scale of the graph will not lose or change its properties.
Point and line coordinates
When a mathematical problem is given in a lesson, it can contain parameters of various geometric shapes, both in the form of side lengths, perimeter, area, and in the form of coordinates. In this case, you may need to both build a shape and get some data associated with it. The question arises: how to find the required information on the coordinate line? And how to build a figure?
 For example, we are talking about a point. Then a capital letter will appear in the problem statement, and there will be several numbers in brackets, most often two (this means we will count in two-dimensional space). If there are three numbers in brackets, written with a semicolon or a comma, then this is a three-dimensional space. Each of the values is a coordinate on the corresponding axis: first along the horizontal (X), then along the vertical (Y).
Remember how to draw a line? You went through this in geometry. If there are two points, then a straight line can be drawn between them. Their coordinates are indicated in brackets if a segment appears in the problem. For example: A (15, 13) - B (1, 4). To build such a straight line, you need to find and mark points on the coordinate plane, and then connect them. That's all!
And any polygons, as you know, can be drawn using line segments. The problem has been solved.
Calculations
Let's say there is some object whose position along the X axis is characterized by two numbers: it starts at a point with a coordinate (-3) and ends at (+2). If we want to find out the length of this object, then we must subtract the smaller from the larger number. Note that a negative number absorbs the sign of the subtraction, because "minus and minus equals plus". So we add (2 + 3) and get 5. This is the desired result.
 Another example: we are given the end point and length of the object, but the initial one is not given (and we need to find it). Let the position of the known point be (6), and the size of the studied subject - (4). Subtracting the length from the final coordinate, we get the answer. Total: (6 - 4) = 2.
Negative numbers
It is often required in practice to work with negative values. In this case, we will move along the coordinate axis to the left. For example, an object 3 centimeters high is floating in water. It is immersed in liquid by a third, and in air by two thirds. Then, choosing the surface of the water as the axis, we, using the simplest arithmetic calculations, get two numbers: the upper point of the object has the coordinate (+2), and the lower one - (-1) centimeter.
It is easy to see that in the case of a plane, we have four quarters of the coordinate line. Each of them has its own number. In the first (upper right) part there will be points with two positive coordinates, in the second - from the top left - the values along the "x" axis will be negative, and along the "yoke" - positive. The third and fourth are counted further counterclockwise.
Important property
You know that a straight line can be thought of as an infinite number of points. We can look as carefully as we want any number of values in each direction of the axis, but we will not find repetitive ones. This seems naive and understandable, but that statement stems from an important fact: each number corresponds to one and only one point on the coordinate line.
Conclusion
Remember that any axes, shapes and, if possible, charts should be drawn using a ruler. The units of measurement were not invented by a person by chance - if you make an error in drawing, you risk seeing the image that was not supposed to turn out.
Be careful and accurate in charting and calculating. Like any science taught in school, mathematics loves precision. Put in a little effort, and good grades will not be long in coming.